

New Home Sales Experienced a Modest Increase in January 2024
by thebestworldevents.com 26 February 2024 · Property Investment
[ad_1]
New Home Sales, commonly referred to as “new residential sales,” is an economic indicator that tracks the sale of newly constructed residences. It is extensively watched by investors since it is seen as a lagging signal of real estate market demand and, thus, a factor influencing mortgage rates. Household income, unemployment, and interest rates are all variables that influence it.
The United States Census Bureau releases two versions of the New Home Sales metric: a seasonally adjusted figure and an unadjusted one. The adjusted value is shown as a yearly total, whereas the unadjusted figure is presented as a monthly total. These numbers are provided for several areas and the entire nation.
New home sales are completed when a sales contract or deposit is signed or accepted. In any stage of construction, the home might be: not yet started, in the process of being built or fully finished. About 10% of the US housing market is made up of new house sales. Preliminary numbers for new single-family home sales are subject to major changes because they are mostly based on data from construction permits.
Analysis of US New Home Sales in January 2024
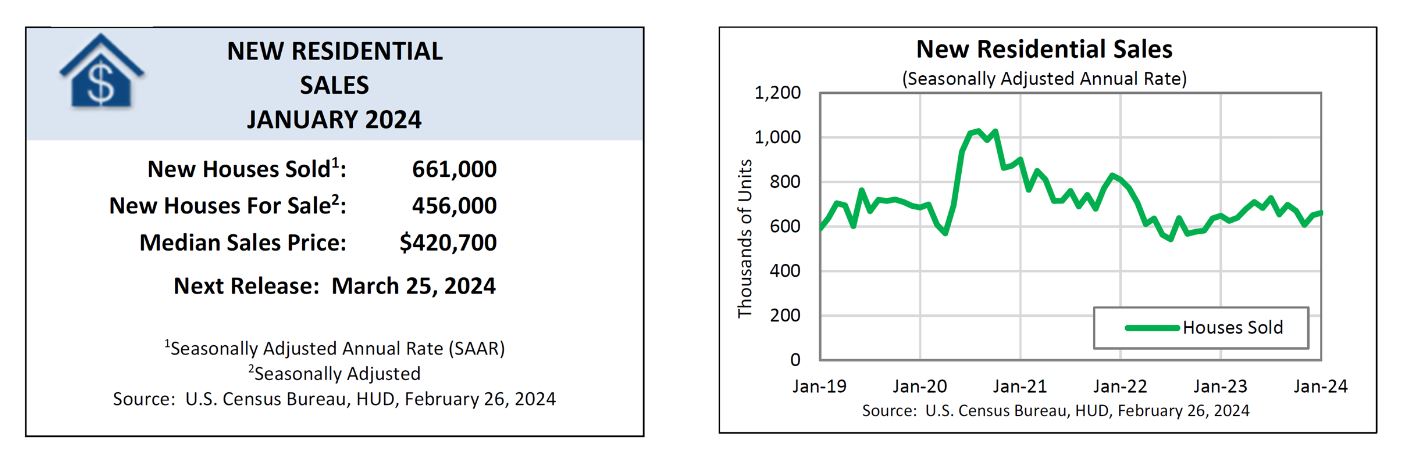
US new home sales experienced a modest increase in January 2024, rising 1.5% to a seasonally adjusted annual rate of 661,000 units, according to the Commerce Department’s Census Bureau. However, this growth fell short of expectations, with the South region particularly affected by a sharp decline. Despite this, the demand for new construction remains robust, fueled by a persistent shortage of previously owned homes.
New Home Sales Performance:
New home sales in January 2024 were 1.5% above the revised December rate, reaching 661,000 units. The year-on-year growth stood at 1.8%. Notably, the Northeast and West regions experienced significant monthly sales increases of 72.0% and 38.7%, respectively. However, the South witnessed a substantial 15.6% decline, reaching its lowest level since September 2022.
New Home Sales Price:
The median sales price of new houses sold in January 2024 was $420,700, with an average sales price of $534,300. This reflects a 2.6% decrease in the median price compared to the previous year.
New Home Market Trends:
The new housing market continues to outperform the market for existing homes, attributed to the persistent inventory shortage in existing homes. As buyers face limited options in the existing home market, they are increasingly turning to new homes.
The month of January experienced freezing temperatures in large parts of the country, which potentially kept some buyers at home. The frigid weather not only impacted new home sales but also affected retail sales, homebuilding, and factory production during the same period.
New home sales, being a leading indicator of the housing market, rose 1.8% on a year-on-year basis in January. However, these sales can be volatile on a month-to-month basis, influenced by factors such as weather conditions.
Future Projections:
Despite the current challenges, a survey from the National Homebuilders Association indicated optimistic signs, with measures of sales over the next six months and prospective buyers reaching six-month highs in February. However, concerns about mortgage rates trending upward may moderate home sales in the coming months.
Mortgage Rate Dynamics:
Mortgage rates have resumed an upward trend, potentially impacting home sales. Economists anticipate mortgage rates to trend lower later in the year. The “lock-in” effect, where many homeowners hold mortgage rates below 4%, is expected to support the new housing market, providing room for further growth.
Inventory and Supply:
The seasonally adjusted estimate of new houses for sale at the end of January was 456,000, representing a supply of 8.3 months at the current sales rate. The distribution of inventory shows that houses under construction account for 59.2%, homes yet to be built make up 23.2%, and completed houses account for 17.5%.
In summary, the US new home sales performance in January 2024 reflects a complex interplay of factors, including regional variations, weather impact, and economic indicators. While challenges exist, the new housing market appears resilient, driven by the persistent shortage of existing homes and potential future developments in mortgage rates.
New Home Sales Trend [Previous Months]
Here’s the region-wise tabular data for new home sales from December 2022 to December 2023. The units displayed are in thousands and are the seasonally adjusted annual rate. The data estimates only include new single-family residential structures. Sales of multi-family units are excluded from these statistics.
NORTHEAST: Connecticut, Maine, Massachusetts New Hampshire New Jersey New York Pennsylvania Rhode Island Vermont
MIDWEST: Illinois, Iowa, Indiana, Kansas, Michigan, Minnesota, Missouri, Nebraska North Dakota Wisconsin South Dakota Ohio
SOUTH: West Virginia, Virginia, Texas, Tennessee, South Carolina, Oklahoma, North Carolina, Mississippi, Maryland, Louisiana, Kentucky, Georgia, Florida, Alabama, Delaware, District of Columbia, Arkansas
WEST: Alaska, Arizona, California, Colorado, Hawaii, Idaho, Montana, Nevada, New Mexico, Oregon, Utah, Washington, Wyoming
Sources
- https://www.census.gov/
- https://www.census.gov/construction/nrs/pdf/newressales.pdf
- https://www.mortgagenewsdaily.com/data/new-home-sales
- https://www.nahb.org/news-and-economics/housing-economics/national-statistics/new-and-existing-home-sales-reports
[ad_2]


