[ad_1]
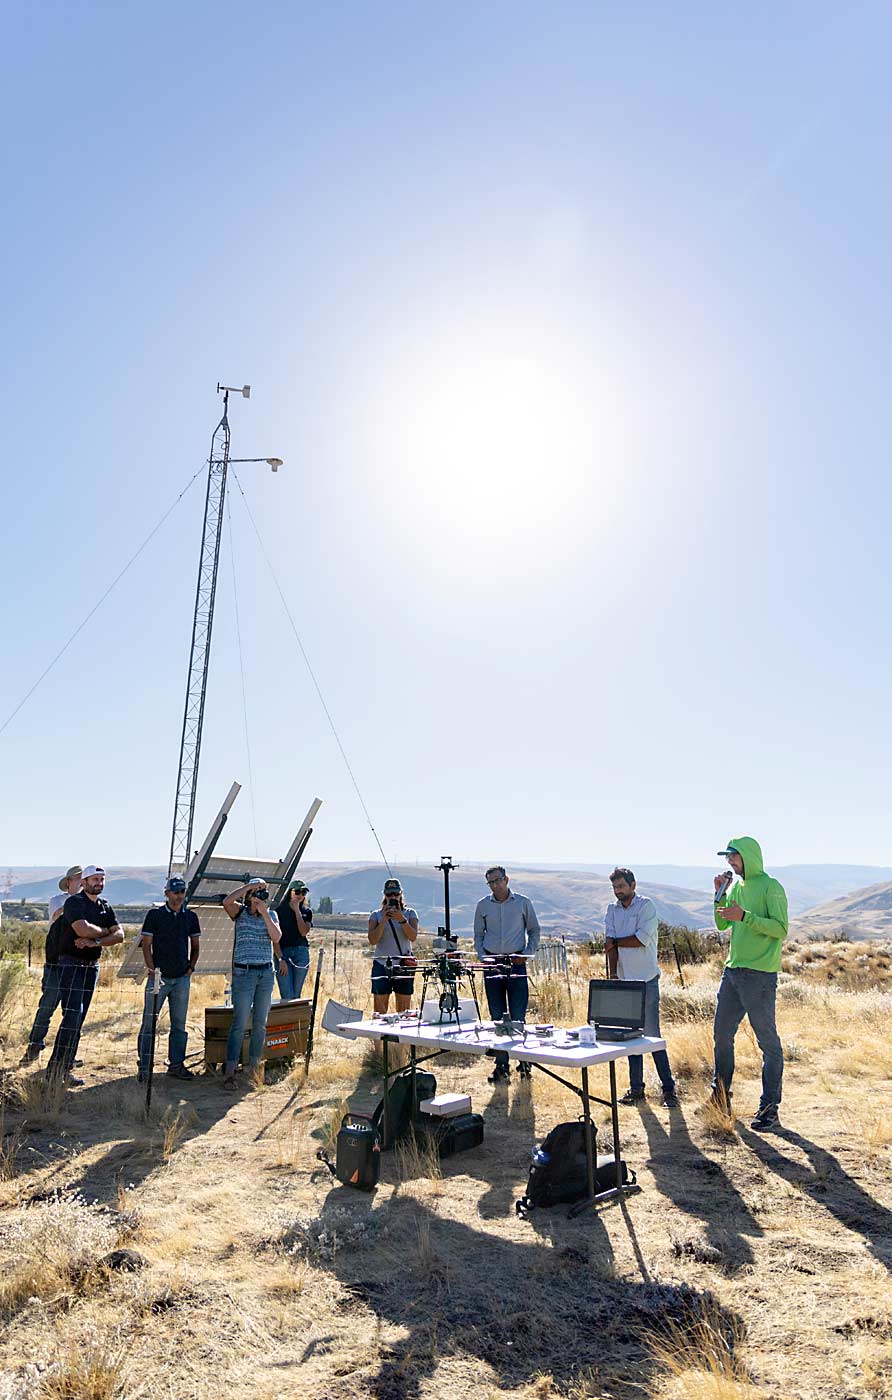
During the AgAID Institute field day, held on a hot September day at Washington State University’s Sunrise Research Orchard outside Wenatchee, WSU researchers explained how new technologies can help growers better protect cherries from cold. From right: Jake Schrader, Srikanth Gorthi and Lav Khot discuss their research into precision frost mitigation using data from 30-foot-high AgWeatherNet towers, like the one behind them, and the drones on the table in front of them to map inversion conditions.(Kate Prengaman/Good Fruit Grower)
Growers’ best tools for frost mitigation — wind machines — need an inversion layer of warmer air above the quickly cooling orchard. Circulating that just-slightly-warmer air can often be enough to keep cherry buds and blooms above critical temperatures.
Weather forecasts and frost alarms alert growers to those dropping temperatures in the orchards, but information on the presence and strength of the inversion part of the equation has been harder to come by.
A recent research project at Washington State University aims to close that information gap — and help growers make better frost protection decisions — by mapping air temperatures on frost nights. Researchers built a new model with a combination of data from AgWeatherNet’s Tier 1 stations, which stand 30 feet tall, recording temperatures at 1.5 meters (5 feet) and 9 meters (30 feet).
“The inversion is the difference between the two,” said Lav Khot, associate professor with WSU’s Center for Precision Agriculture and Automated Systems and the director of AgWeatherNet. That information could help growers estimate the inversion strength over their orchards, relative to the nearest stations, and determine if conditions are favorable for wind machines or if they should turn to supplemental heat instead.
The inversion-strength forecast is now available for about 30 tower stations in WSU’s network and will soon be displayed on the cold hardiness model pages as well, Khot said, and additional towers after this year of data collection. Also this year, growers can get daily station-specific forecasts for all stations in the network to watch for frost events, thanks to machine-learning models the AgWeatherNet team has built.
Next up: “We want to predict the inversions for the stations where we don’t have 9-meter sensors,” he said.
This spring marks the third year of data collection for the precision frost mitigation research project funded by a grant from the U.S. Department of Agriculture’s Cyber-Physical Systems program.
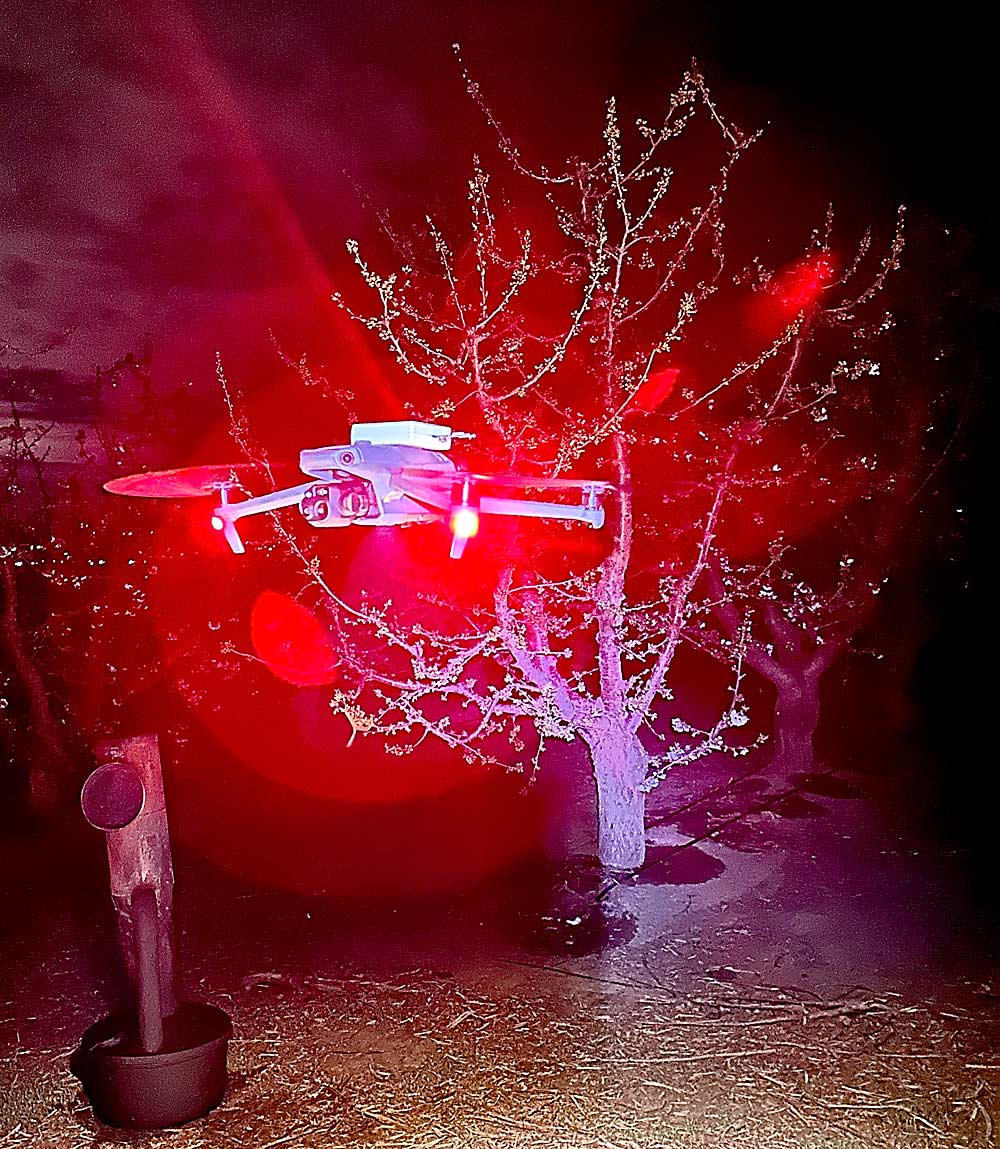
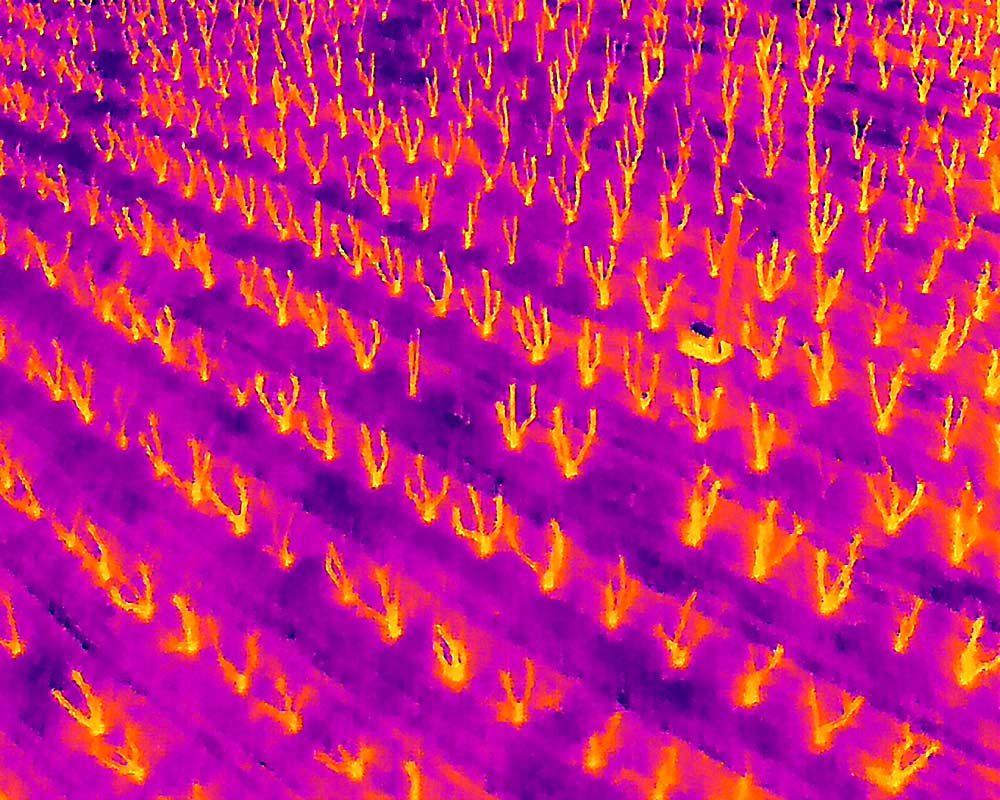
Another aspect of the project focused on commercial orchards. Researchers flew drones equipped with thermal sensors during cold events to gather data on cold air movement across orchard terrain. They are still crunching data on how efficient the wind machines are under different conditions and how far their sphere of protection extends.
Experienced growers already know their frost-risk areas, but sensor data can fill the gaps in new orchards or for new management, Khot said.
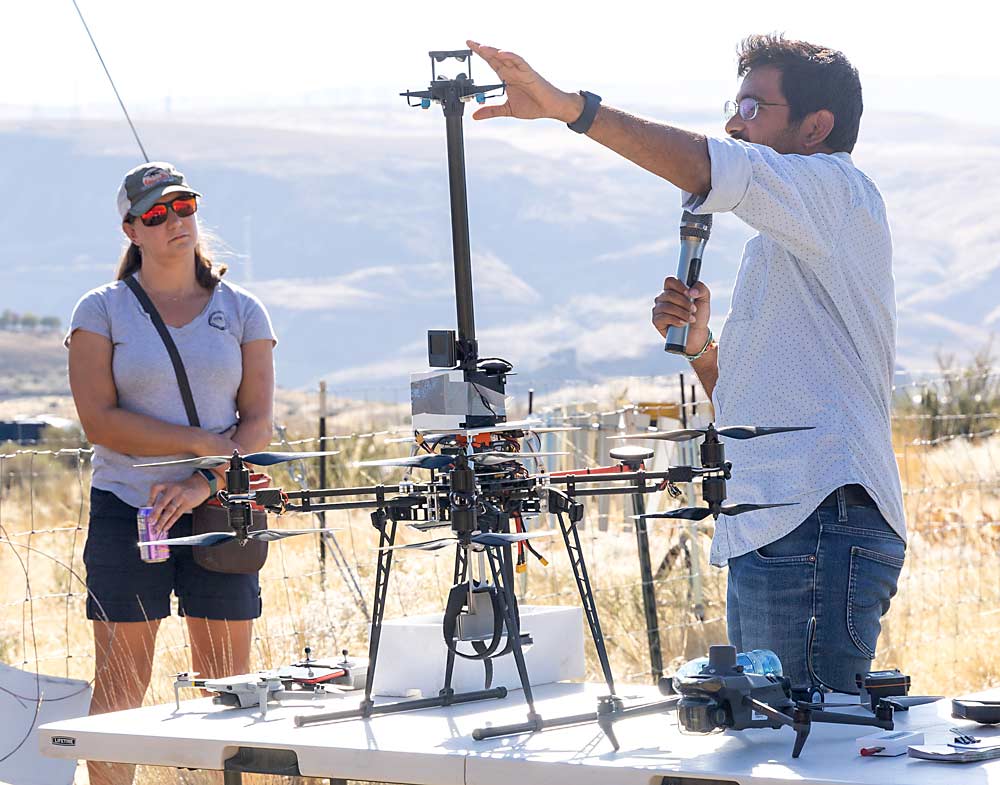
Flying a drone with a temperature sensor during frost events can identify at-risk spots more effectively than the common practice of driving around and checking thermometers or putting one on your truck. The graduate students who worked on the project, Srikanth Gorthi and Jake Schrader, presented a low-cost monitoring approach at a field day last summer: a $500 drone and a $400 thermocouple sensor affixed with Velcro stickers.
“When you establish an orchard, get a thermal map of temperature distribution to decide where the wind machines need to go,” Khot said, along with a topographic map. “You can use the data from these sensing tools to decide.”
Commercial technology is getting smarter, too.
Grower Seth Hayden hosted the WSU researchers at Hayden Farms outside Pasco the past two years; they fly their drones mapping the temperatures while he’s busy checking 35 wind machines. All the machines are now equipped with the ORCell temperature sensors and auto-start system from Orchard-Rite.
That automation makes it easier to manage frost nights, Hayden said, and the app alerts him if any machine requires attention.
As such systems have proliferated, there’s no clear best practice for where to put the temperature sensor that triggers them, Gorthi said.
“If you put it too close to the wind machine, that can cause it to turn on and off really frequently,” he said. Plus, the machine’s engine puts out heat that can throw off readings.
Hayden has his sensors about 50 feet from the wind machines, connected by wires that can be at risk from other farm activities.
The thermal mapping approach should be able to guide growers on the best placement and number of sensors that activate wind machines and sensors that watch how effectively they are working to mitigate the cold, Khot said.
Gorthi also set up two systems to measure the temperature of cherry buds during frost events, and he found that the bud itself is typically several degrees colder than the surrounding air temperature.
Buds will cool more quickly than the air until temperatures hit the dew point, which is the point at which the water in the air condenses into frost, releasing heat and slowing cooling. In dry climates, the dew point is lower, and if it’s below the critical temperature, damage can occur quickly.
To measure that, he used both thermocouples inserted into buds (something he admits only researchers would use) and a radiative frost sensor from Apogee Instruments that is designed to simulate plant temperatures during frost events. Both recorded bud temperatures between 1 and 4 degrees colder than the air temperature. Gorthi published these findings in a WSU Fruit Matters article in February, concluding that more research into the relationship between air and bud temperatures could improve predictions of lethal temperatures.
“Each frost night is different,” he said, citing wind speed, humidity and cloud cover’s influence.
As WSU gathers data on each different set of frost conditions, those will feed into machine-learning models to find the patterns and improve AgWeatherNet’s predictions.
—by Kate Prengaman
[ad_2]


